Before we delve into the uses of SVD, we will take a short detour. The rank of a matrix is the number of linearly separable rows (or columns) in the matrix, which means that:
if (row[i] + x) * y + z = row[j]
then rows i and j are not linearly separable
Computing the rank is done by mutating the matrix into row echelon form, which substitutes a row of zeros for all of the rows which are considered "duplicates" under linear separability. Here is a tutorial on row echelon form:
https://stattrek.com/matrix-algebra/echelon-transform.aspx#MatrixA
This matrix has a rank of 1 because it is possible to generate any 3 of the rows from the fourth row with the above formula, and to generate the remaining columns:
[1,1,1,1]
[2,2,2,2]
[3,3,3,3]
[4,4,4,4]
This is called linear separability. Rank gives a primitive measurement for the amount of correlation between rows or columns. SVD is more nuanced. It implements linear separability as a continuous measurement whereas rank is only a discrete measurement. Separability is scored by Euclidean distance, and SVD creates a relative ranking of how close each row is to all other rows, and how close each column is to every other column. This ranking gives a couple of useful measurements about the matrix data:
- It gives a more nuanced measurement of separability than just the rank. It gives a vector of numbers which give the relative amount of separability across multiple columns.
- By ranking the distances among rows & columns, it gives a scoring of centrality, or "normal vs outlier".
This matrix has a rank of 2 because while it is not possible to generate matching rows or columns, they are close:
[1,2,3,4]
[2,3,4,5]
[3,4,5,6]
[4,5,6,7]
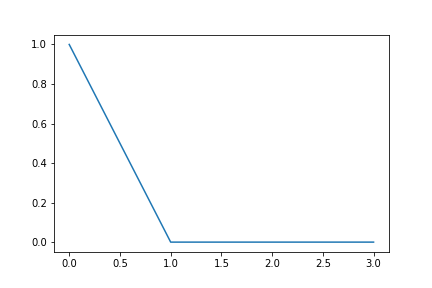
SVD generates a list of numbers called the "singular values" of a matrix. Here are the singular values for the above 2 matrices:
[1.00000000e+00 8.59975057e-17 2.52825014e-47 3.94185361e-79]
[9.98565020e-01 5.35527830e-02 1.96745978e-17 9.98144122e-18]Let's chart these singular value vectors (linear scale):These charts tell us that the first matrix has a rank of 1. The second matrix has a rank above one, but does not have two full rows of uniqueness. This chart is a measurement of the correlation between rows and correlation between columns. The singular values of a matrix are a good first look at the amount of "information" or "signal" or "entropy". "Quantity of signal" is a fairly slippery concept with mathematical definitions that border on the metaphysical, but the singular values are a useful (though simplistic) measurement of the amount of information contained in a matrix.Based on the term "entropy" in the previous paragraph, let's try filling a larger matrix with random numbers. This is the measurement of a 20x50 random matrix, with a chart in log scaled on the Y axis:Rank = 20 Singular values:[0.35032972 0.322733 0.30419963 0.29269556 0.28137789 0.26201005 0.25742231 0.23075557 0.21945011 0.21763414 0.20245292 0.1976021 0.175207 0.16692658 0.14884194 0.14208821 0.13474842 0.12291441 0.10004981 0.08849001]The graph should be a straight line but is not, due mainly to the fact "random numbers" are very hard to come by. This matrix has rank of 20- you cannot multiply & add any row and get another row. In fact, all rows are equidistant under Euclidean distance. Let's do something sneaky: we're going multiply it by itself to get a 50x50 matrix of random numbers. Here's are the measurements (again, a log-Y chart):Rank = 20 [1.14271040e+02 9.69770480e+01 8.61587896e+01 7.97653909e+01 7.37160653e+01 6.39172571e+01 6.16984957e+01 4.95777248e+01 4.48387835e+01 4.40997633e+01 3.81619300e+01 3.63550994e+01 2.85815085e+01 2.59437792e+01 2.06268491e+01 1.87974231e+01 1.69055603e+01 1.40665565e+01 9.31997487e+00 7.29072452e+00 1.50274491e-14 1.29473245e-14 1.24897761e-14 1.11334989e-14 1.03937520e-14 9.90176181e-15 9.17746567e-15 8.94074462e-15 8.58805508e-15 7.94287894e-15 6.90962668e-15 6.72135898e-15 6.02639348e-15 5.66356533e-15 5.16429606e-15 4.84762468e-15 4.47711092e-15 4.37266408e-15 4.27780206e-15 3.43884568e-15 3.21440817e-15 2.83815151e-15 2.61710432e-15 2.34685343e-15 2.24348424e-15 1.32915906e-15 9.12392110e-16 5.65320744e-16 2.64346262e-16 1.11941235e-16]Huh? Why is the rank still 20? And what's going on with that chart? When we multiplied the matrix by itself, we did not add any information/signal/entropy to the matrix! Therefore it still has the same amount of separability. It's as if we weighed a balloon, filled it with weightless air, then weighed it again.In this post, we discussed SVD and the measurement of information in a matrix; this trick of multiplying a random matrix by itself to blow it up was what helped me understand SVD ten years ago. (Thanks to Ted Dunning on the Mahout mailing list.)


I've fast-forwarded like mad through days of linear algebra lecture, in order to give intuitive understanding about matrix analysis. We'll be using SVD in a few ways in this series on my explorations in Neural Networks. See this page for a good explanation of SVD and a cool example of how it can be used to clean up photographs. :
Source code for the above charts & values available at:
No comments:
Post a Comment